
88% of Companies Use AI. Only 6% See Real Results.
Sick of the hype? Same.
Most AI talk right now is 80% slides and 20% hand-wavy demo. Everyone’s got a pitch. Everyone’s promising transformation. But when you ask for proof, you get case studies from other industries, pilots that never scaled, or metrics your board doesn’t care about.
We spent the past few months measuring what happens when AI becomes part of how software actually gets built. Real code. Real quality gates. Real results.
Here’s what we found.
The Metrics Problem
Let’s be honest about what’s happening in most boardrooms right now.
Someone asks: “How’s our AI going?” And the answer comes back in adoption rates. Number of users. Satisfaction scores. Maybe a story about how a team saved a few hours last week.
These numbers feel safe. They’re easy to collect. And they tell you almost nothing about whether AI is actually changing how your organisation works.
Adoption rate measures whether people logged in. What matters is whether the work got better, faster, or cheaper. You can have 95% adoption and zero transformation.
We kept hearing from executives: “AI means small improvements. Worth a pilot. Nothing to restructure around.”
Our data showed otherwise. So we measured it properly.
What Happens When AI Is Inside the Work
We tracked 153 changes on a production SaaS codebase. Real software. Real quality standards. Real deployment.
Speed to value: 274x faster.
The median time from intent to merged code was 26 minutes. The DevOps Performance Report (DORA) says elite teams aim for under one day. This is 274 times faster than the industry standard.
Output that compounds:
• 5.8x increase in code output
• 20.2x increase in net code after refactoring
• 22.5x more merged code overall
Quality held up.
98% of this code was AI co-authored. It passed security scans, test coverage checks, and maintainability reviews. The kind of quality gates most enterprise teams struggle with on human-only code.
These results came from AI embedded in the actual flow of building software. Explore, edit, run, debug, ship. All in one continuous loop, without handoffs or waiting for review cycles.
What the Research Confirms
McKinsey’s 2025 State of AI report found that 88% of organisations now use AI in at least one business function. But only 6% qualify as “high performers” seeing real impact on their bottom line. The gap between using AI and getting results from AI is enormous.
Gartner predicted that 30% of generative AI projects will be abandoned after the initial trial by end of 2025. The top reasons: poor data quality, unclear value, and growing costs. Most projects stall because they were bolted onto old ways of working.
The DORA 2024 report shows that only 19% of software teams perform at the top level. The high-performing group actually shrank from 31% to 22% year over year. Getting faster is hard. Staying fast is harder.
The common thread: the technology works. The organisations using it need to change. The bottleneck is how work is structured.
Where Does Your AI Sit?
This is the core question. There are two ways organisations use AI, and they lead to very different results.
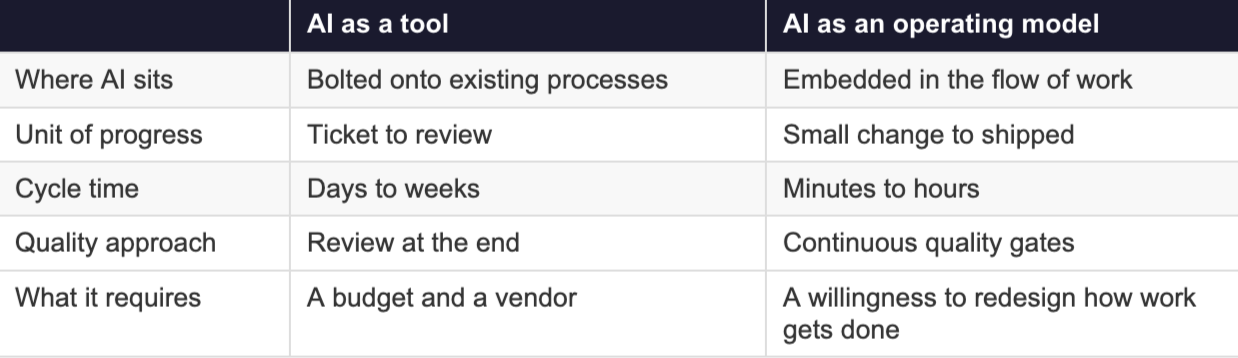
Most organisations sit on the left. That’s the 88% who’ve adopted AI. The 6% getting real results sit on the right.
The left column is safer. You can run a pilot, show adoption numbers, and call it progress. The right column is harder. It means changing team structures, rethinking quality gates, and letting go of processes that feel familiar.
So which column describes your AI investments right now?
Why Most Initiatives Stall
The workflow automation trap. Workflow tools are great for predictable, repeatable tasks. Define steps. Execute steps. Done. But product development is messy. Requirements change. Unexpected situations pop up. Context matters. When you apply an automation mindset to AI, you get a faster version of the old sequential playbook. Specs go in. Code comes out. Someone reviews it. That’s automation with extra steps.
The measurement trap. If you measure adoption rate and user satisfaction, you’ll optimise for adoption rate and user satisfaction. You’ll get more people using AI tools. You won’t necessarily get better outcomes. The metrics that matter are lead time to value, deployment frequency, code quality, and business impact. Most organisations don’t track these for their AI initiatives.
The pilot trap. Most AI pilots are designed to succeed in controlled conditions. Small scope. Clean data. Enthusiastic team. The question is what happens when you scale. What happens when requirements are ambiguous. What happens when it breaks. If your pilot can’t answer those questions, it’s a demo, not a test.
What to Do About It
If you’re a leader trying to cut through the noise, start here.
Measure what matters. Ask your teams what they’re tracking. If the answer is adoption rate, push harder. You need lead time, quality metrics, and deployment frequency. These tell you whether AI is changing how work gets done, or just how work gets started.
Look at where AI sits. Is it a separate tool people switch to? Or is it inside the actual flow of work? The answer tells you which column of that table you’re in.
Stress-test your pilots. Ask what happens at scale. Ask what happens with ambiguity. Ask what happens when something fails. A pilot that only works in perfect conditions is a slide deck, not a strategy.
Talk to people with real numbers. Not vendors. Not consultants selling frameworks. People who’ve deployed AI in production and can show you what changed. The data exists. Most people just aren’t asking for it.
The hype is exhausting. But underneath it, something real is happening. The organisations that see it clearly enough to act will pull ahead. Everyone else will stay stuck on adoption metrics that never move the needle.
At Neu21, we measure what actually works. If you want to see how AI transformation looks with real data behind it, let’s have a conversation.
References
1. The State of AI in 2025 — McKinsey & Company
2. Gartner Predicts 30% of Gen AI Projects Abandoned After PoC — Gartner
3. Accelerate State of DevOps Report 2024 — DORA / Google Cloud